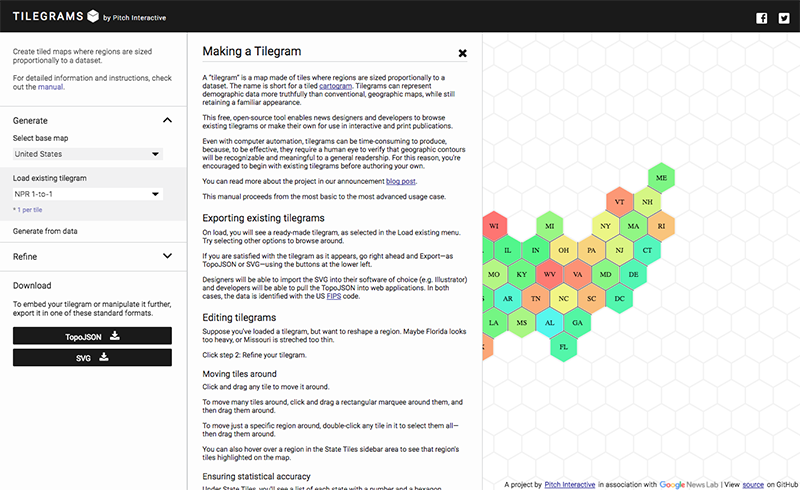
Tilegrams was a project that came out of a desire to create better ways to map data to geography. Cartograms are the traditonal way mapmakers use geographic space to represent data, but they can be difficult to make. This tool helps people create and edit their own tiled cartograms based on an uploaded or default dataset.